Check back soon
Once posts are published, you’ll see them here.


Geospatial point patterns such as deforestation, crime, disease occurrence and fires (among others) change across space and time. Identifying how a given geospatial phenomenon has changed over time and space can provide valuable insights into both past and emerging trends, changing landscapes and contexts. While spatial patterns are not inherently predictive, identifying statistically significant clusters of a given phenomenon can facilitate additional analysis into the role of different drivers in producing the discerned patterns. ESRI’s Space-Time Pattern Mining Toolbox ( ArcGIS Space Time Pattern Mining toolbox) allows for mapping the spatial-temporal distribution of geospatial point phenomenon. We used this to identify the spatial-temporal changes in deforestation patterns in Kalimantan and Sumatra in Indonesia from 2001 to 2018 (https://doi.org/10.1002/ece3.7562).
The Emerging Hot Spot Analysis tool evaluates spatiotemporal patterns in the geospatial point phenomenon, in this case, deforestation in two Indonesian provinces using a combination of two statistical measures: (1) the Getis-Ord Gi* statistic to identify the location and degree of spatial clustering of forest loss, and (2) the Mann-Kendall trend test to evaluate temporal trends across the time series. The Getis-Ord Gi* statistic measures the intensity of clustering of high or low values (in this case forest loss) by generating Z scores (standard deviations) and P values (statistical probabilities) for each bin that indicate whether forest loss in a given bin is statistically clustered compared to the loss in neighbouring bins. The Mann-Kendall statistic was used to identify the presence of a temporally significant trend. Through this analysis, we mapped the different deforestation clusters in both Sumatra and Kalimantan.
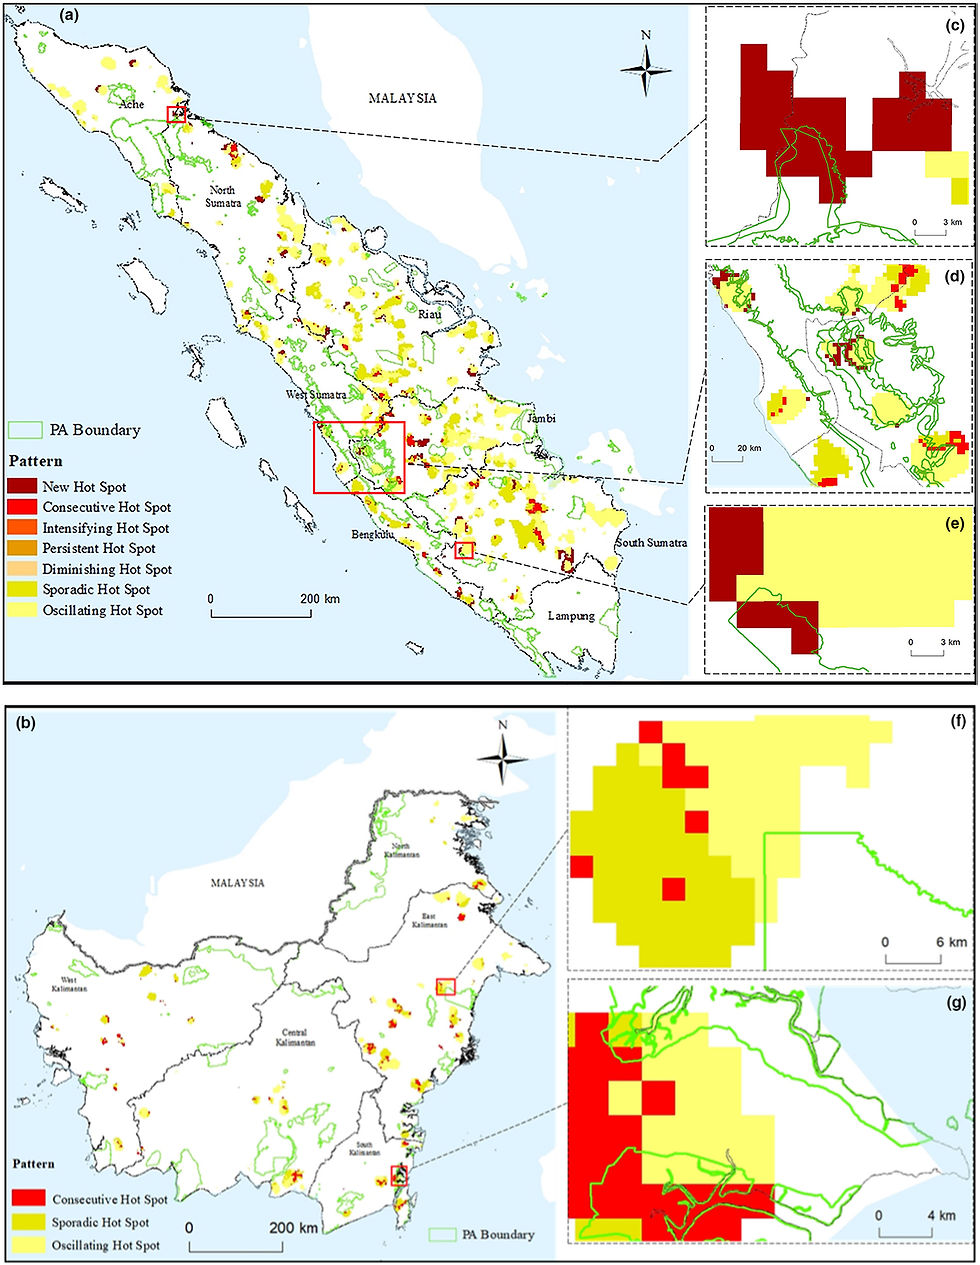
Different Deforestation Hotspot Types in Sumatra and Kalimantan
The Emerging Hot Spot Analysis tool helped map the distinct categories that cover a range of scenarios: one category of non-significance along with eight hot spots each reflecting a different configuration of spatiotemporal significance. For instance, only three hotspots patterns (oscillating and sporadic–85%; consecutive–15%) were detected in Kalimantan, all concentrated in the eastern and coastal regions. Consecutive hotspots suggest that these locations had continuously higher forest loss than their surroundings throughout the study period.
Decision trees identified the most important drivers of deforestation in Sumatra and Kalimantan, including the average human footprint, average wood fibre, and average oil palm distance and topographic factors along with helping visualise how these different drivers contribute to the emergence of distinct deforestation patterns.
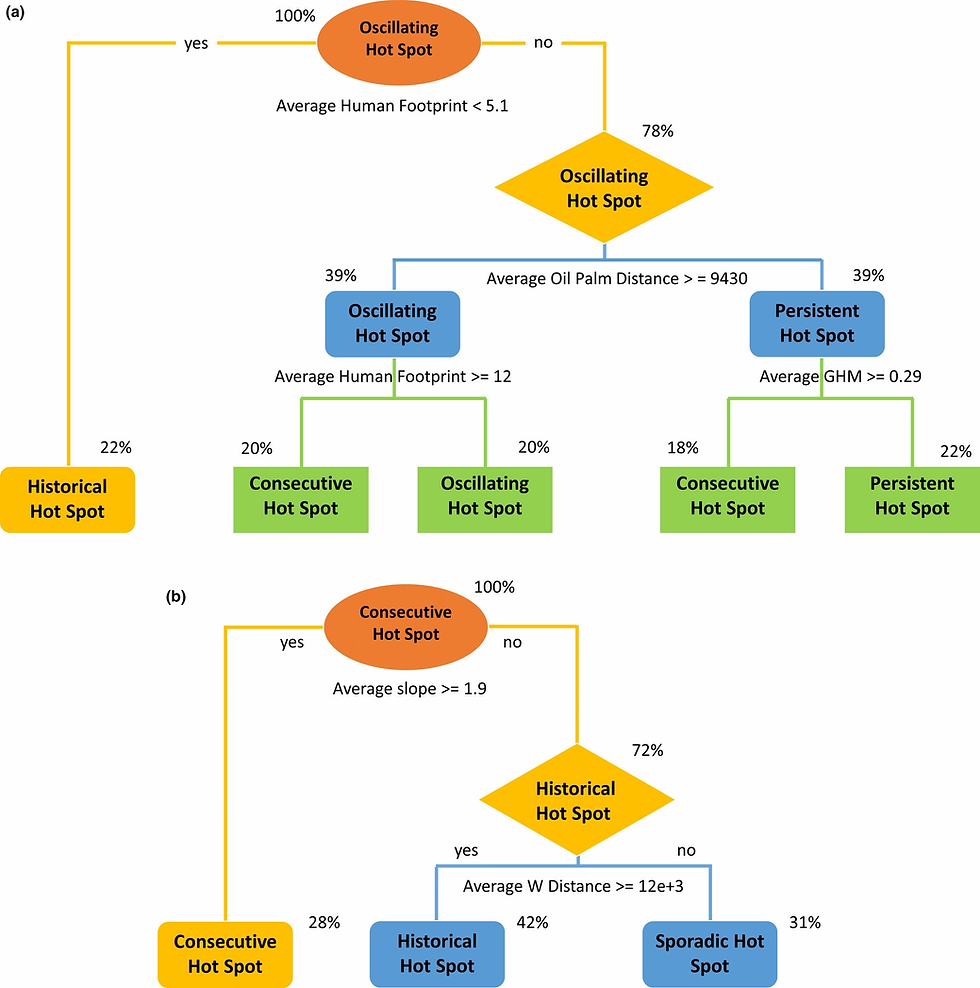
Decision Trees For (a) Sumatra and (b) Kalimantan
The average human footprint values of less than 5.1 corresponded with historical deforestation hotspots in Sumatra. Average human footprint values of greater than 5.1 and oil palm plantation distance greater than 9,430 m corresponded with persistent deforestation hotspots. Average human footprint values greater than or equal to 12 resulted in consecutive deforestation hotspots. Consecutive deforestation hotspots had a higher average human footprint (13.3 ± 1.34) than intensifying and oscillating hotspots (8.75 ± 1.53 and 10.6 ± 0.70, respectively) in Sumatra. Topographic factors, on the other hand, were more significant drivers of deforestation hotspot emergence in Kalimantan.


Comments